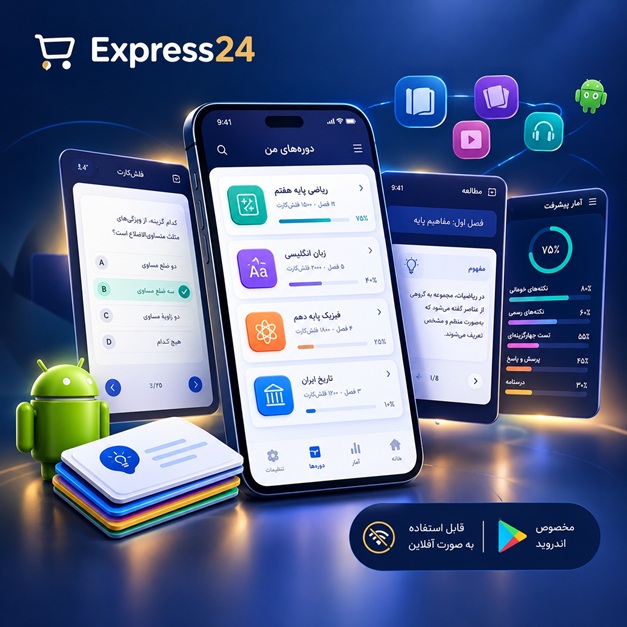
اپلیکیشن اندرویدی فلشکارت آموزشی ایجاد گزارشهای خودکار سری زمانی
🎓 دوره آموزشی جامع
📚 اطلاعات دوره
عنوان دوره: دوره ایجاد گزارشهای خودکار سری زمانی
موضوع کلی: برنامهنویسی بصری و تعاملی
موضوع میانی: تجسم سریهای زمانی (Time Series Visualization)
📋 سرفصلهای دوره
- 1. fundamentals of time series data structures
- 2. introducing visual programming concepts for reports
- 3. setting up python environment for time series projects
- 4. basic line charts with matplotlib for temporal data
- 5. interactive line plots using plotly express
- 6. customizing aesthetics: colors, fonts, themes
- 7. handling date axes & formatting timestamps
- 8. rolling window calculations & moving averages
- 9. seasonal decomposition of time series components
- 10. preprocessing: handling missing data & interpolation
- 11. time zone awareness & localization in visualizations
- 12. connecting to data sources: local csv files
- 13. connecting to databases: sql queries for series data
- 14. api integration: fetching live time series data
- 15. building reusable visualization functions
- 16. designing report cover pages & branding elements
- 17. structuring multi-page report layouts
- 18. generating pdf reports automatically
- 19. exporting reports to html for web embedding
- 20. converting reports to excel & csv formats
- 21. automating report delivery via email smtp
- 22. scheduling reports with cron jobs & task runners
- 23. integrating with google calendar & date triggers
- 24. user interface: control widgets for date range filtering
- 25. interactive dropdowns for metric selection
- 26. drill-down capabilities in time series views
- 27. real-time data updating in generated reports
- 28. caching strategies for performance optimization
- 29. error handling & logging in automated pipelines
- 30. version control for report templates & scripts
- 31. deploying reports on cloud platforms: heroku, pythonanywhere
- 32. dockerizing time series report applications
- 33. api endpoints for report consumption by other systems
- 34. user authentication & access control for reports
- 35. designing dashboards for executive summaries
- 36. comparative analysis: multiple time series on one chart
- 37. anomaly detection & flagging in visual reports
- 38. forecasting basics: moving beyond historical visualization
- 39. custom color palettes for data-driven design
- 40. accessibility compliance: color contrast & screen readers
- 41. responsive design for mobile & tablet report viewing
- 42. building plugin architecture for extensibility
- 43. integrating with business intelligence tools: powerbi connector
- 44. looker studio integration & data source setup
- 45. generating pdf reports with watermarks & confidentiality notes
- 46. adding interactive hover tooltips & data values
- 47. building user-selectable date presets (last 7d, last 30d, ytd)
- 48. exporting interactive html widgets for sharing
- 49. optimizing large dataset visualization performance
- 50. using plotly dash for interactive report apps
- 51. building toggle switches for show/hide trends
- 52. integrating slider controls for real-time filtering
- 53. generating weekly, monthly, quarterly report cycles
- 54. customizing table outputs within reports
- 55. adding summary statistics to report conclusions
- 56. designing print-ready report layouts
- 57. incorporating user feedback loops into report updates
- 58. multilingual support for report labels & titles
- 59. audit trails: logging who generated which report when
- 60. security best practices: protecting data sources & api keys
- 61. case study: sales performance automatic reporting
- 62. case study: website analytics visualization dashboard
- 63. case study: IoT sensor data time series reporting
- 64. best practices for naming conventions in code & reports
- 65. final project: building end-to-end automatic time series report system
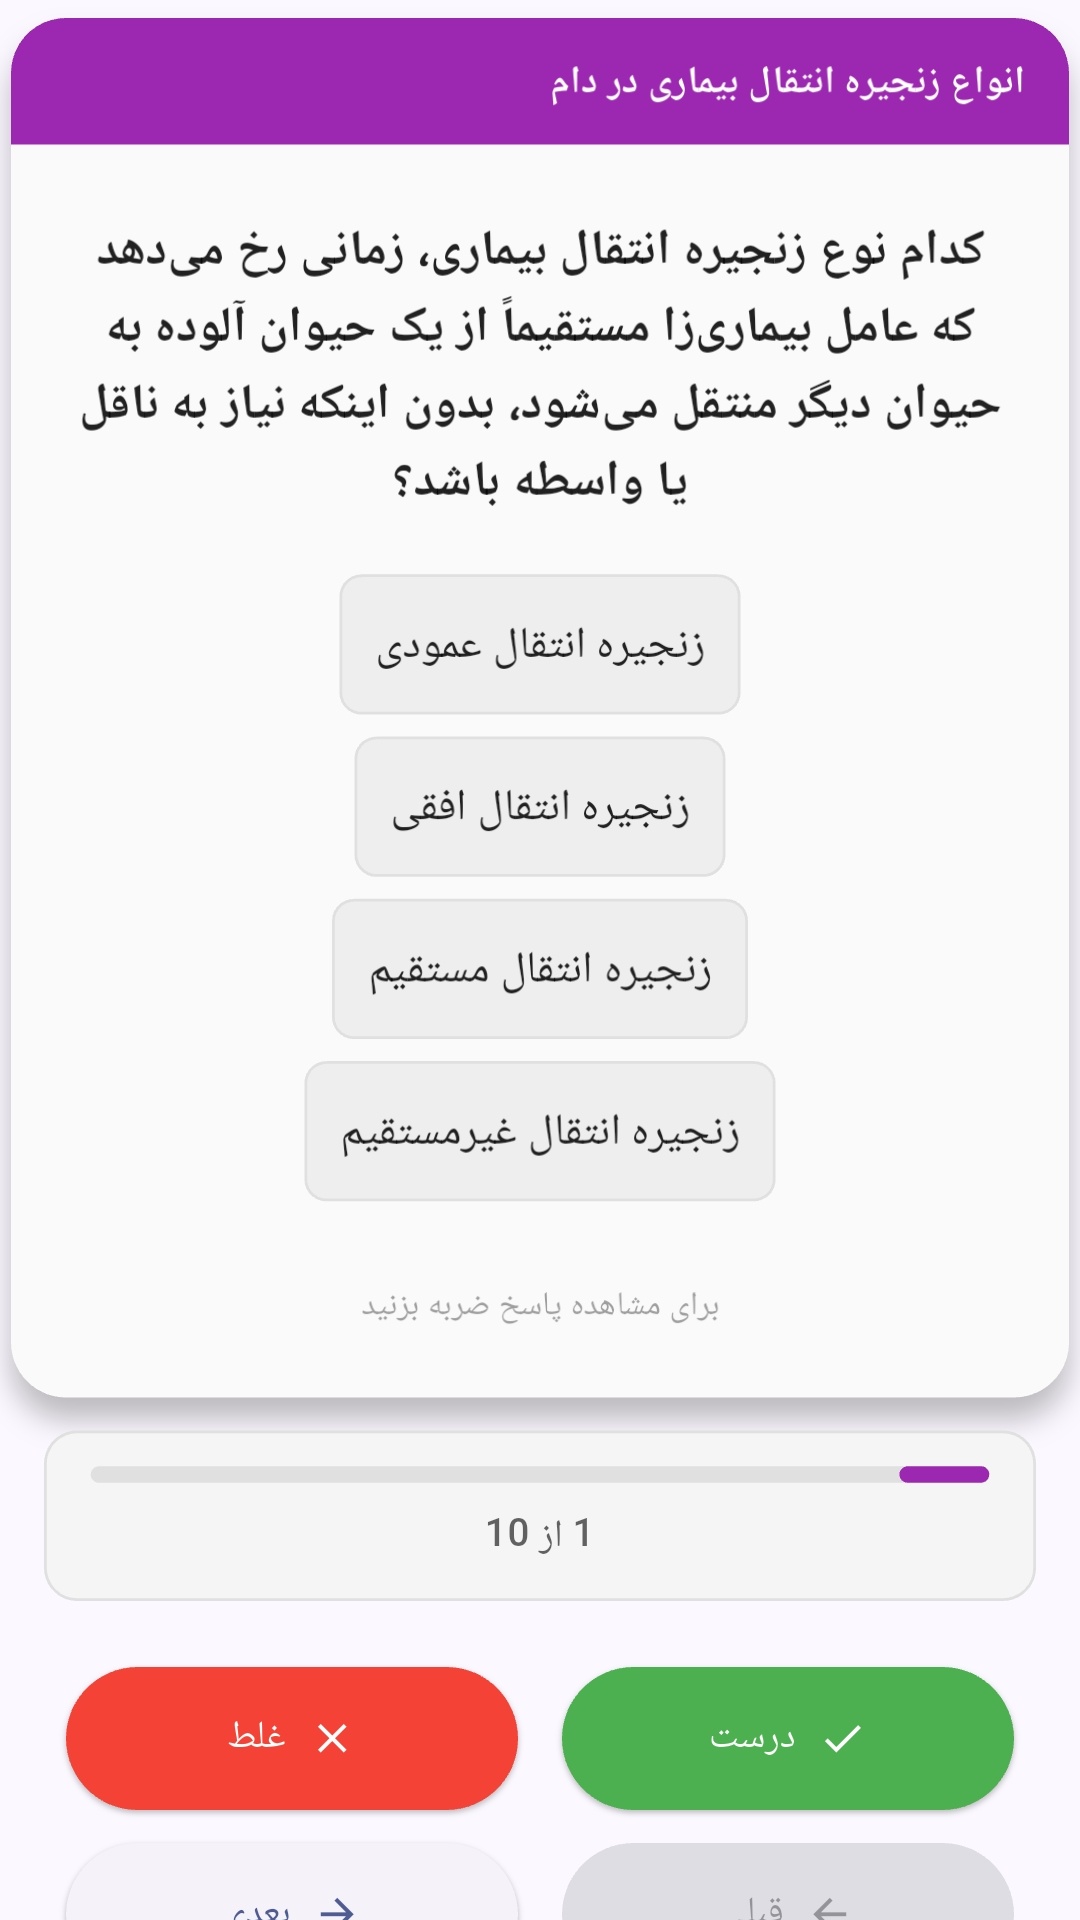
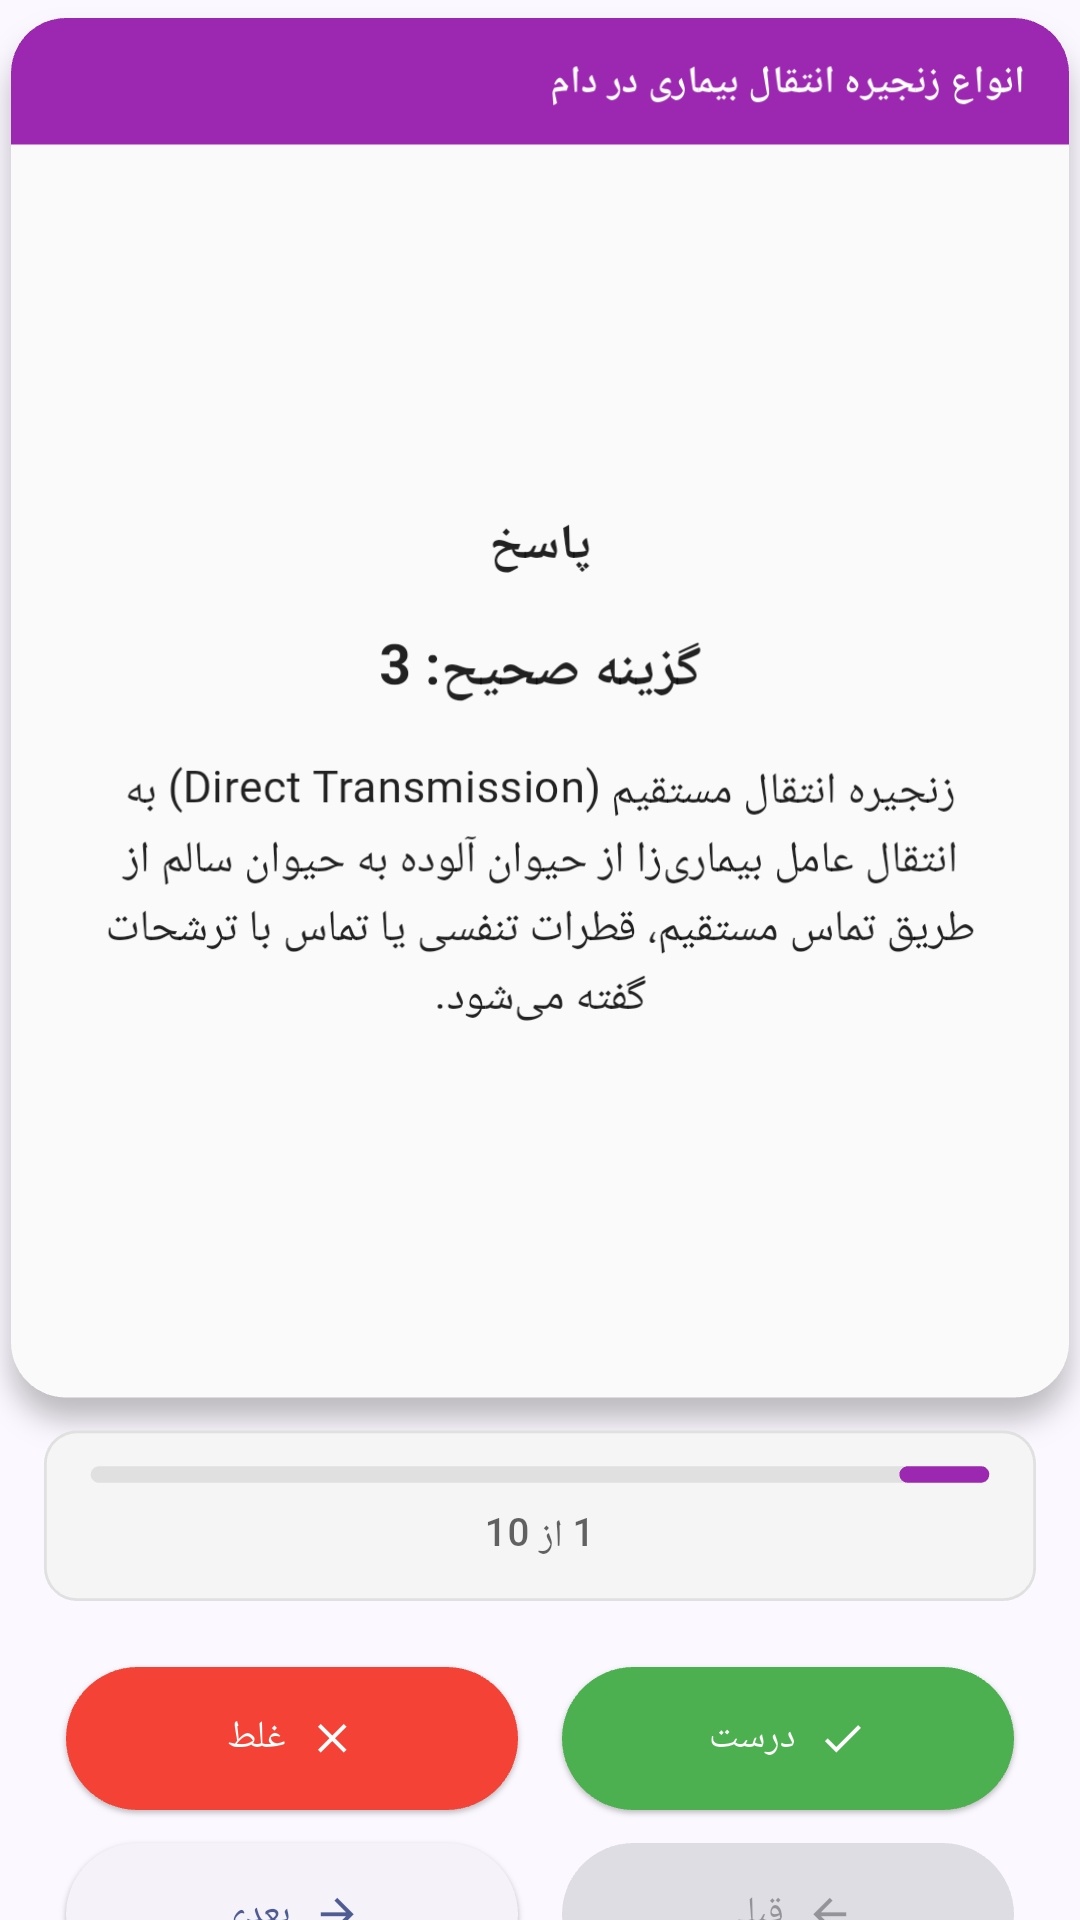
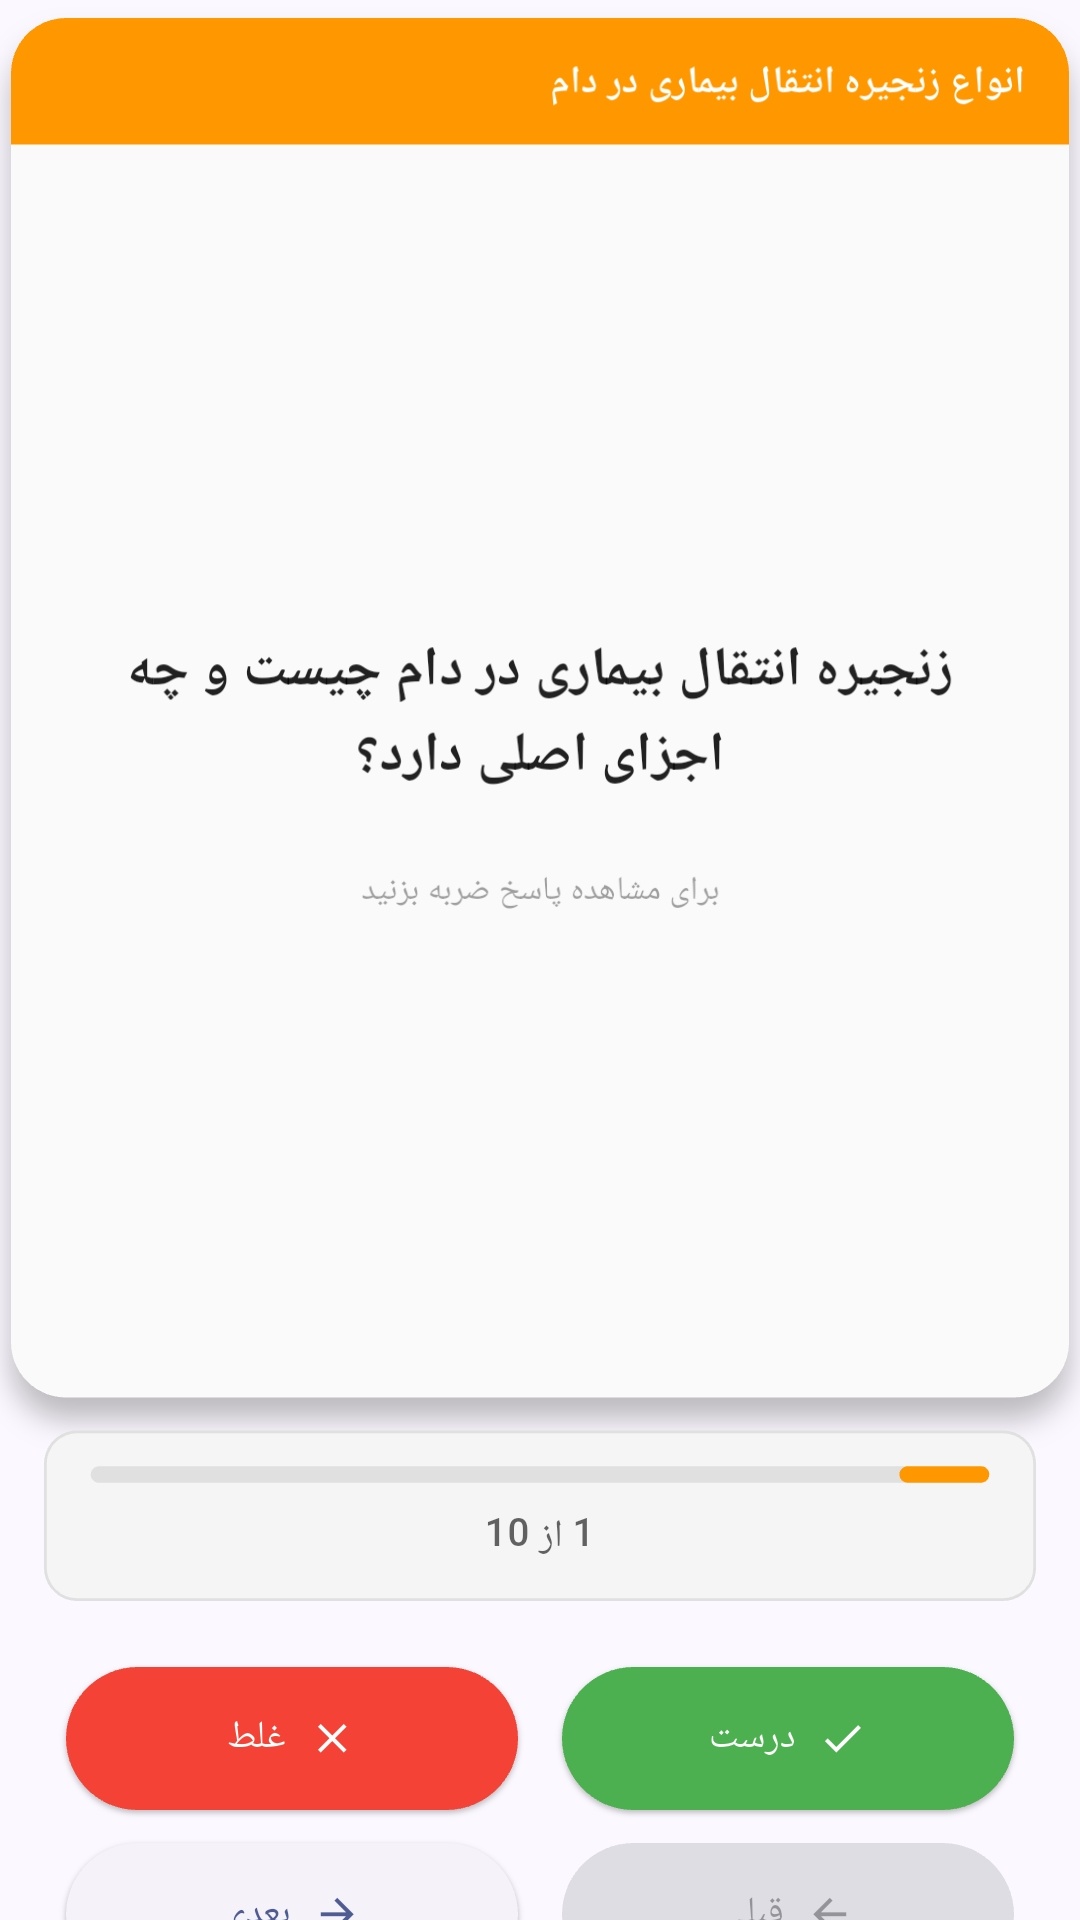
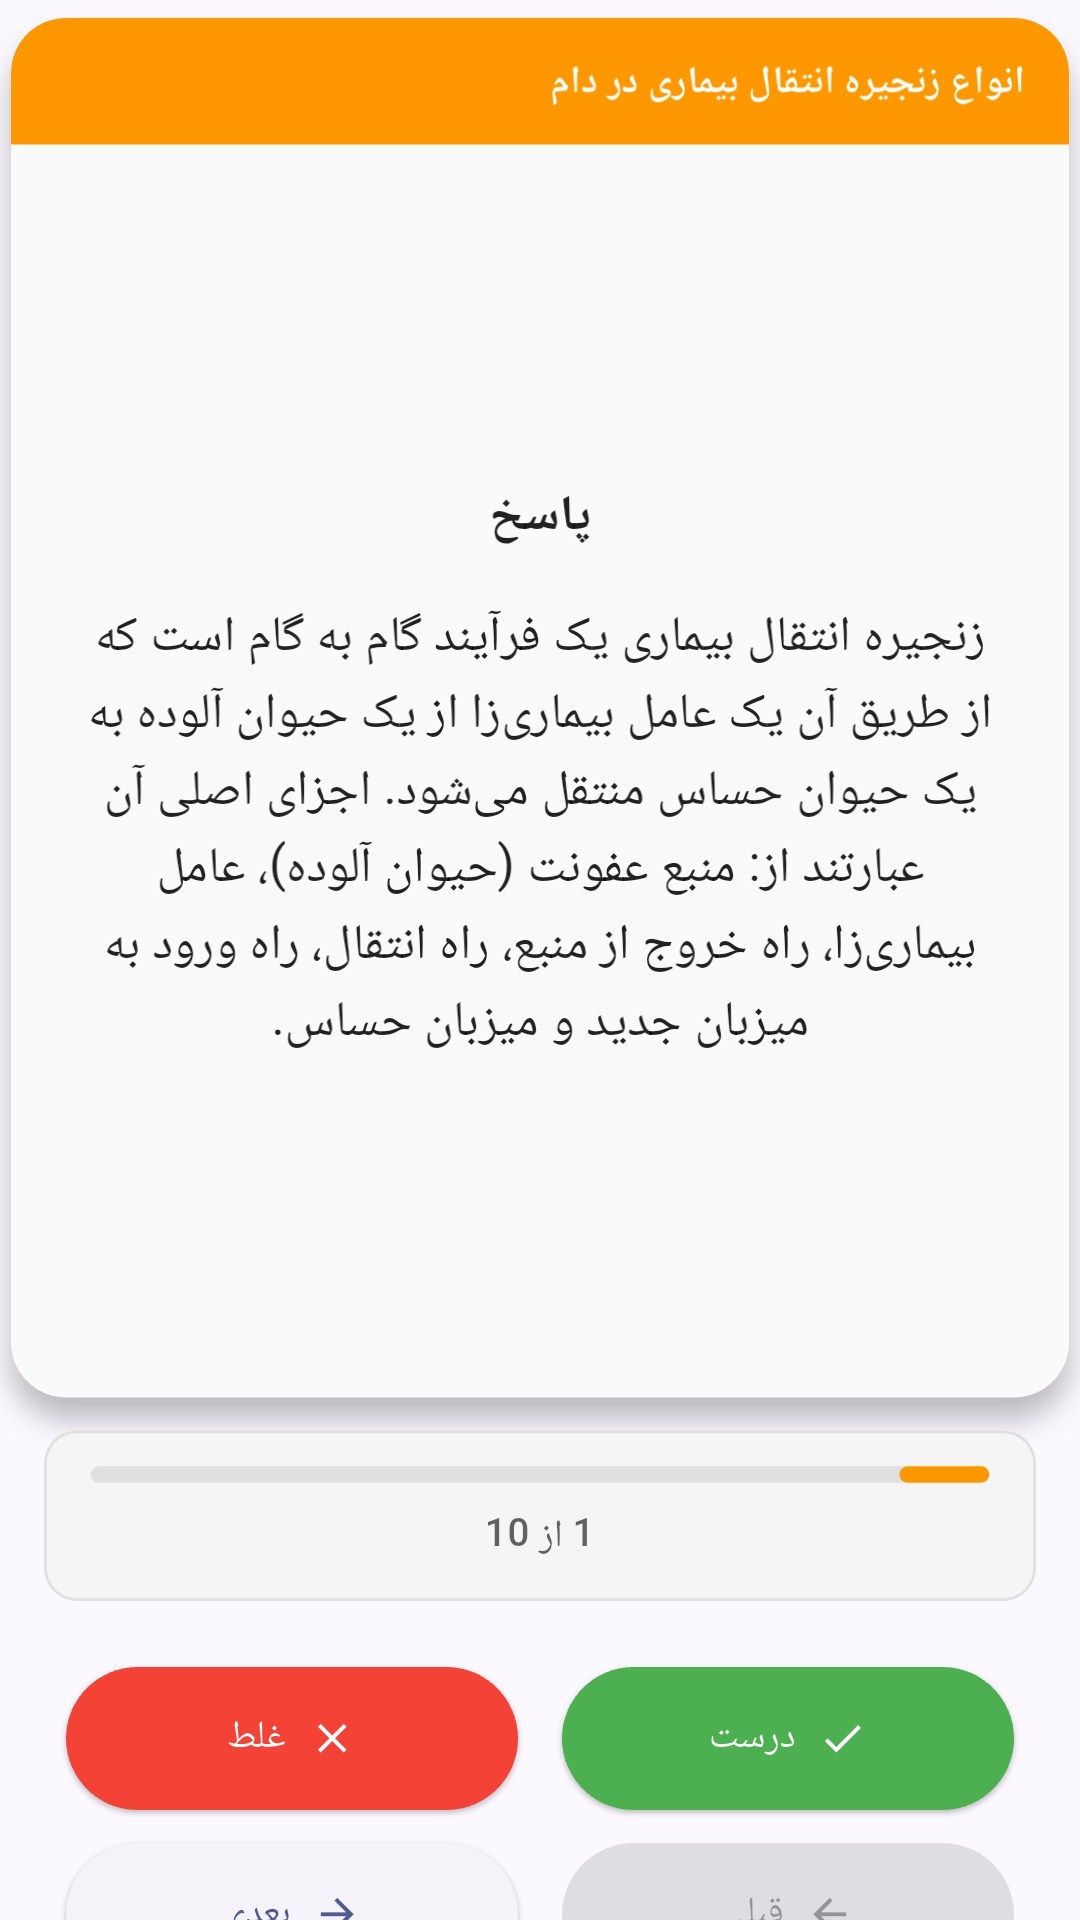
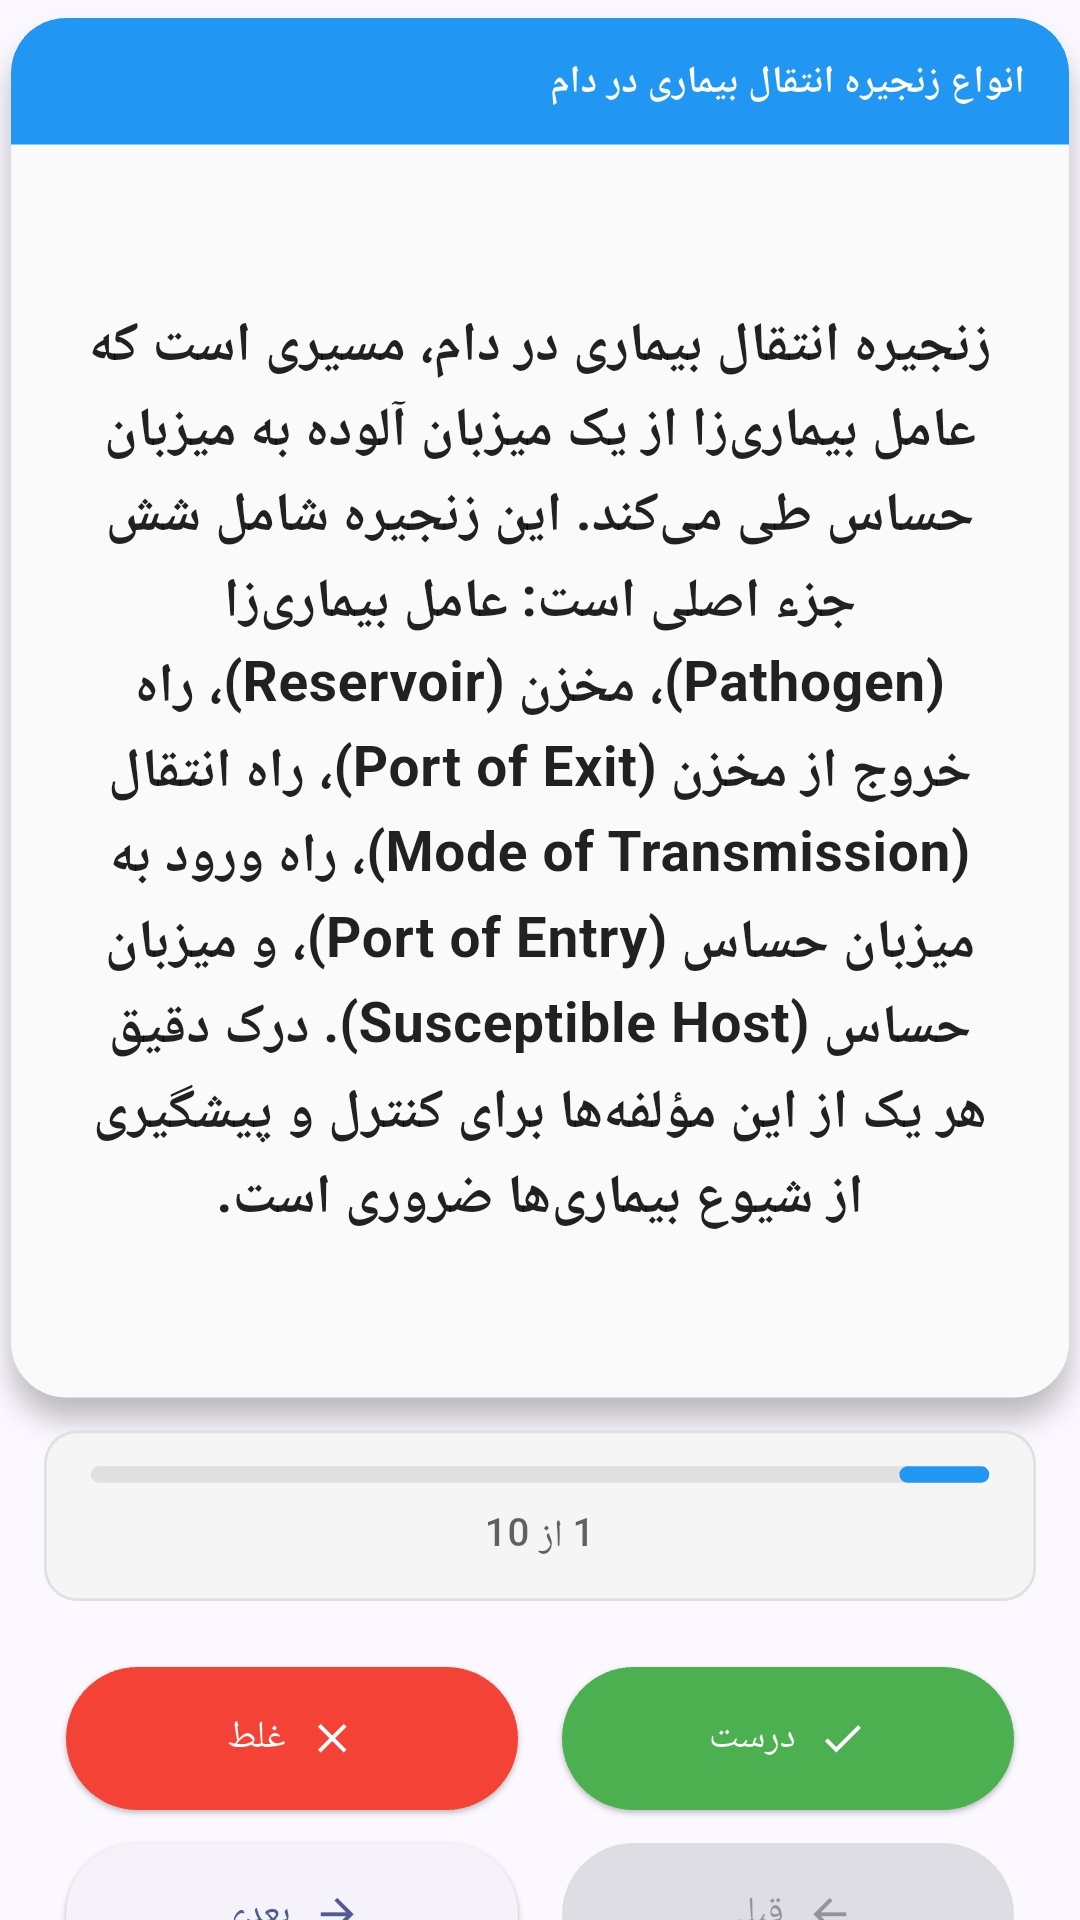
این اپلیکیشن فارسی برای یادگیری و مرور محتوای آموزشی از طریق فلشکارت طراحی شده است. کارتها را یکییکی مرور کنید، پاسخ پرسشها را به یاد بیاورید و نتیجه هر پاسخ را ثبت کنید. محتوای دوره پس از نصب درون برنامه در دسترس است تا برای مطالعه روزمره معمولاً به اتصال مداوم اینترنت نیاز نداشته باشید.
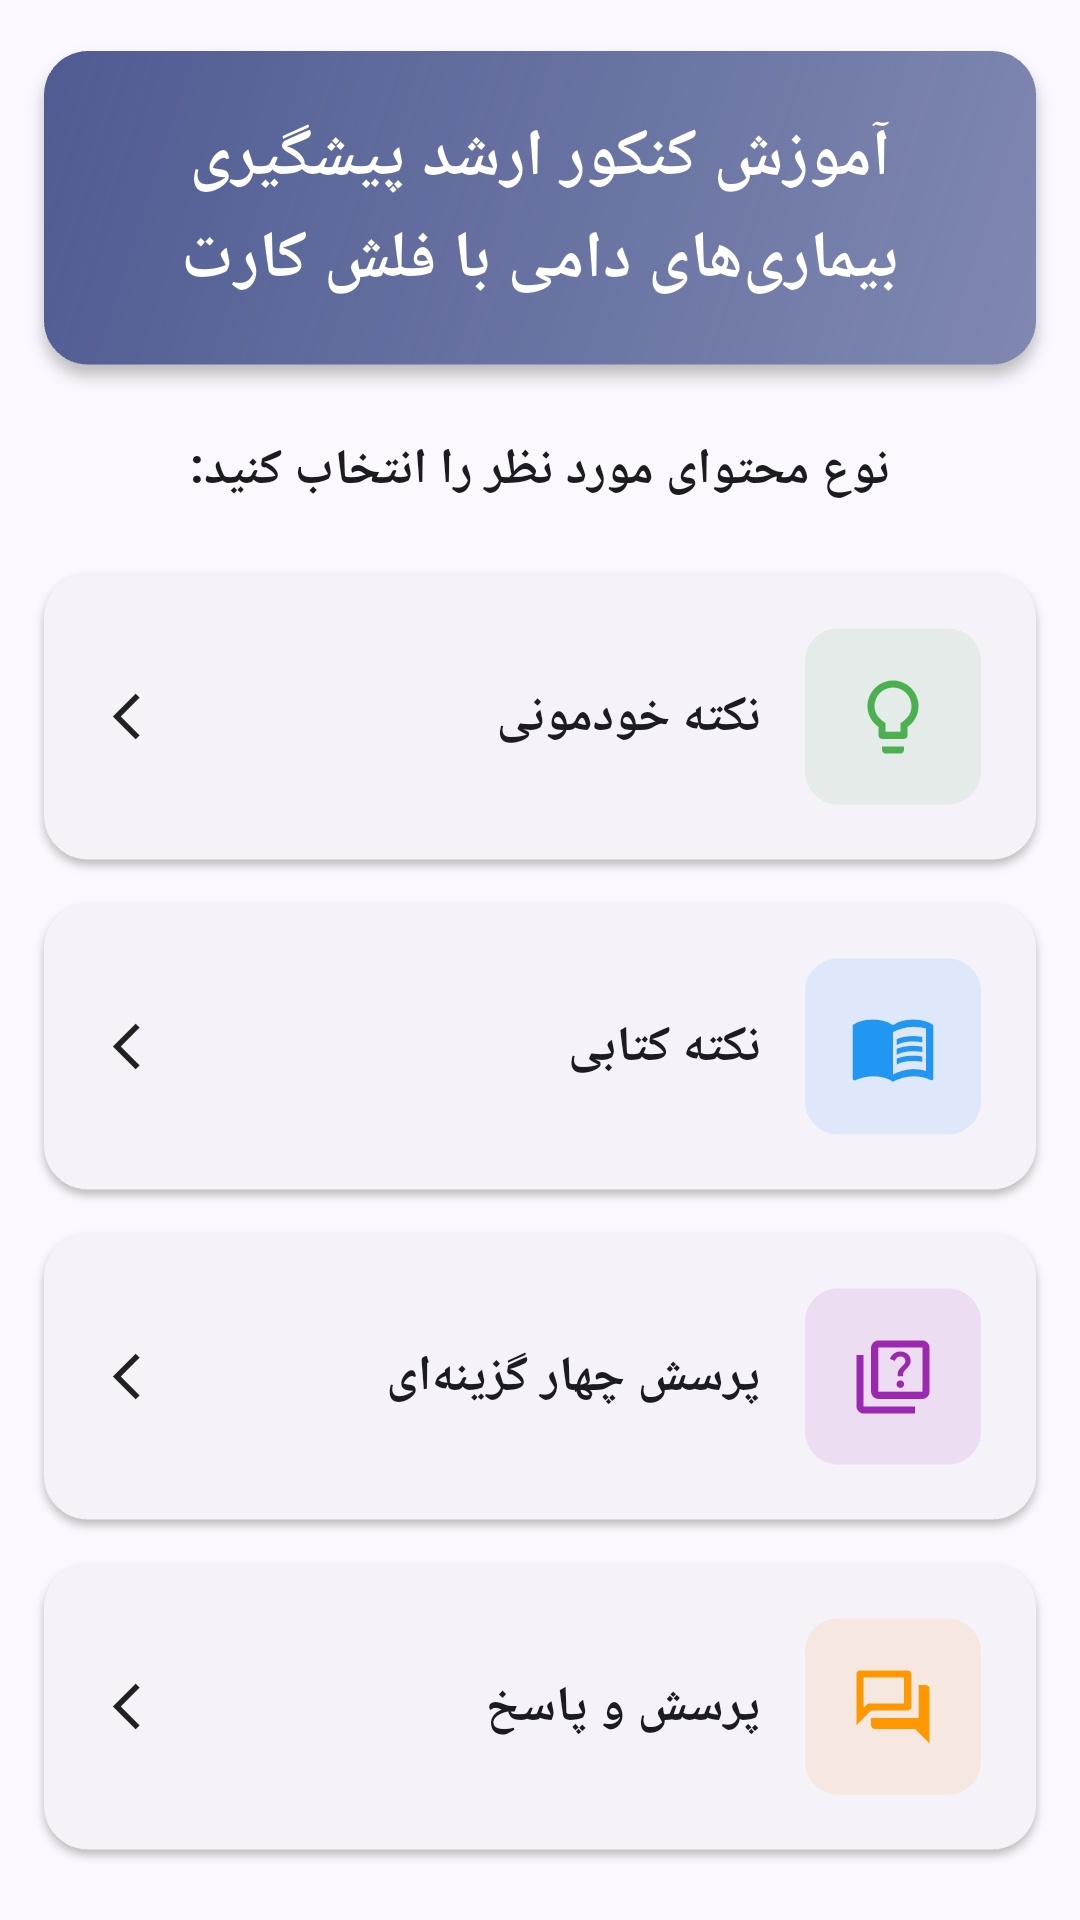
محتوای آموزشی در قالبهای متنوع ارائه میشود تا هم برای یادگیری مفاهیم جدید و هم برای تثبیت آموختهها قابل استفاده باشد.
- رابط کاربری فارسی و راستچین با فونت وزیر.
- تم روشن و تیره مطابق تنظیمات سیستم.
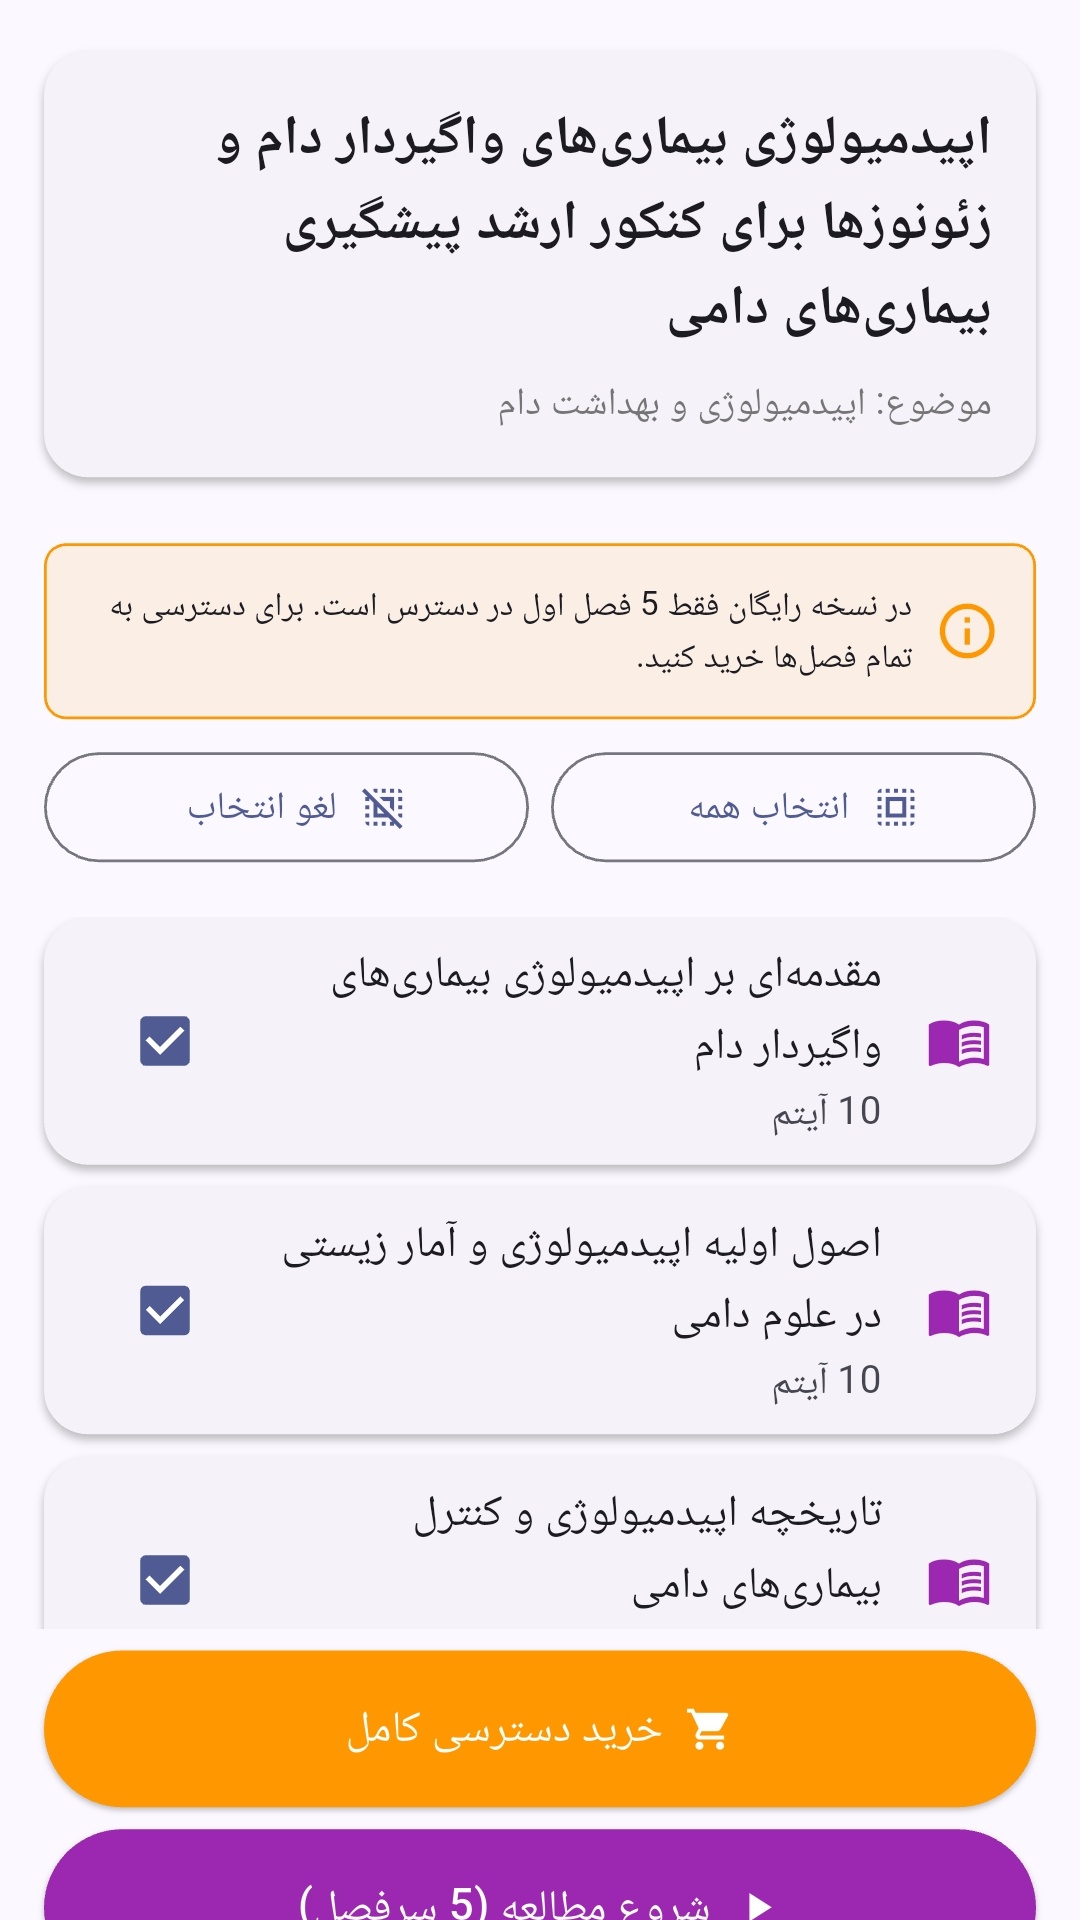
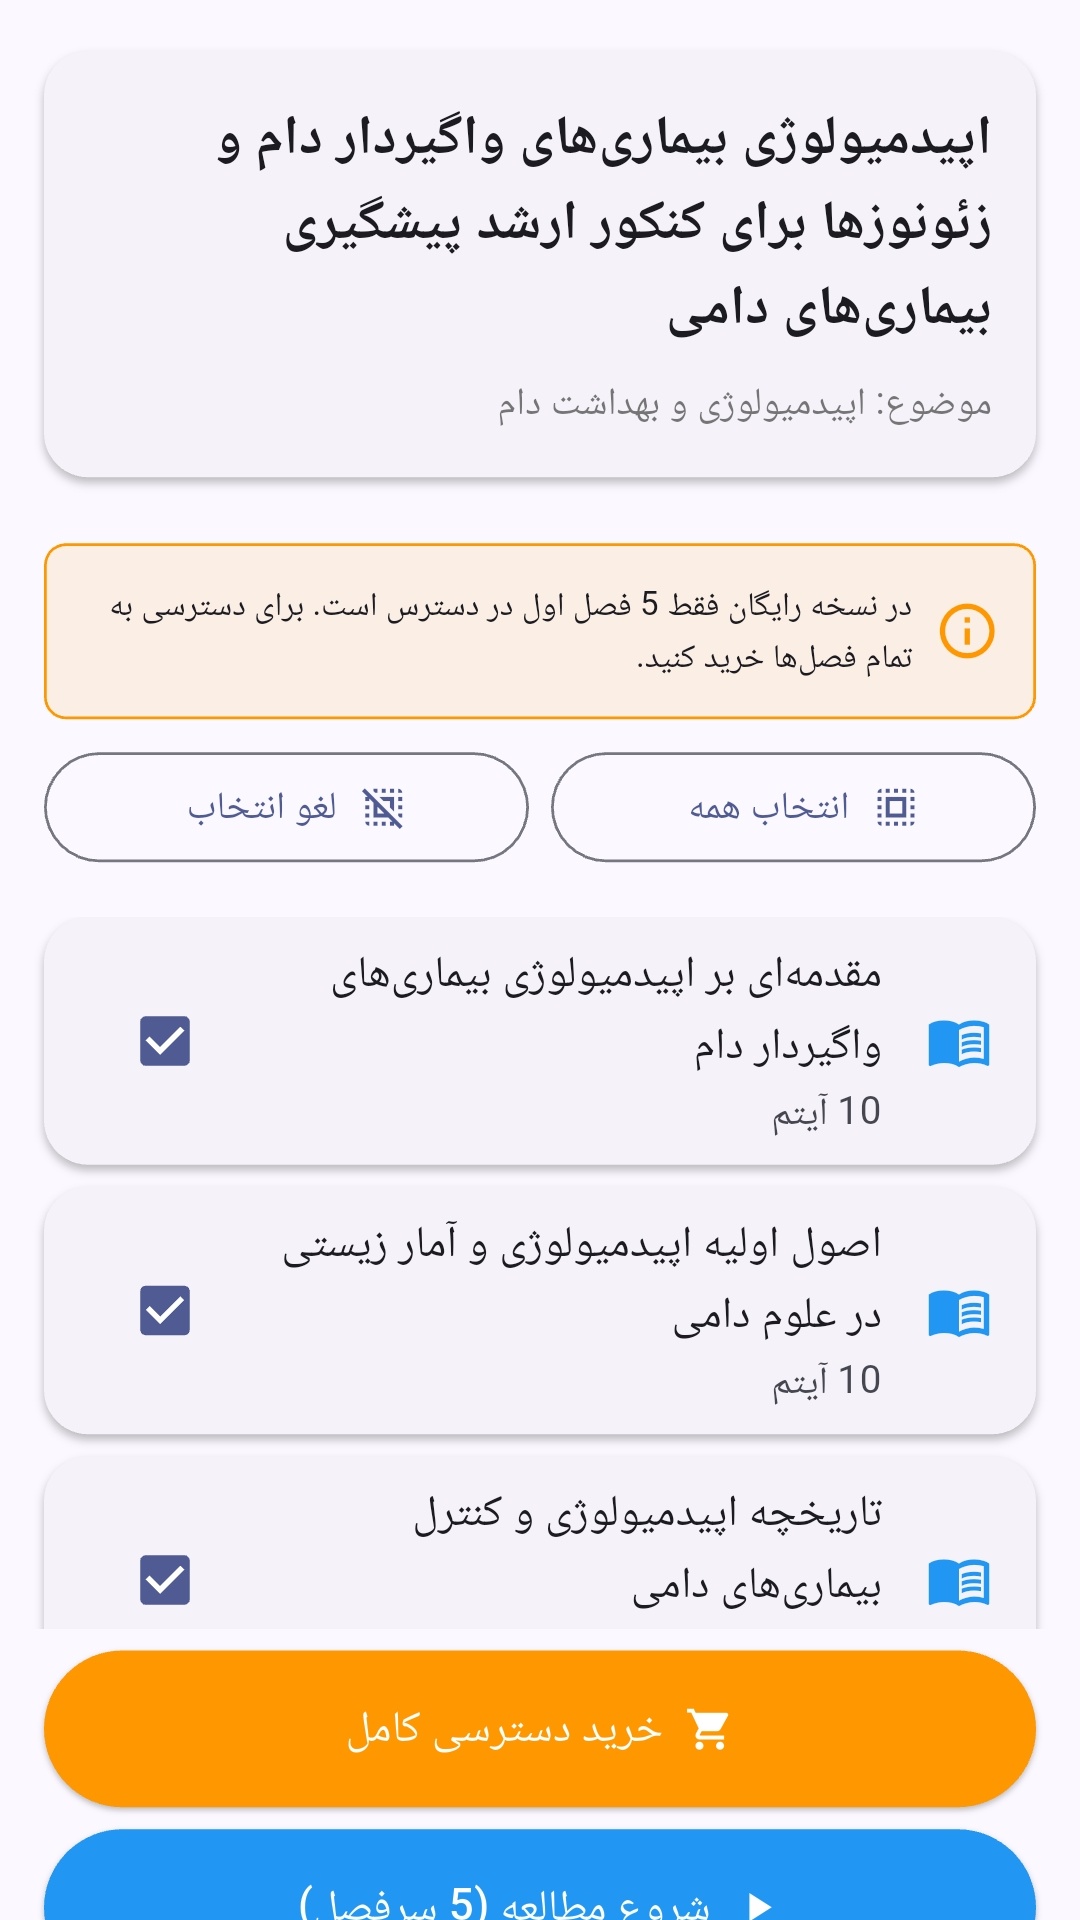
- صفحهبندی ساده برای انتخاب دوره و شروع مرور.
- نمایش تعداد دفعات مرور هر فصل.
- انتخاب چند فصل برای مرور همزمان.
- امکان تمرکز بر فصلهایی که هنوز مرور نشدهاند.
این اپلیکیشن برای دانشآموزان، دانشجویان، داوطلبان آزمونها و علاقهمندان به یادگیری طراحی شده است؛ بهویژه کسانی که میخواهند مطالب آموزشی را در زمانهای کوتاه مرور کنند، دانستههای خود را بسنجند و مطالعه منظمتری داشته باشند.
نظرات
هنوز نظری ثبت نشده است.
وارد شوید تا نظر ثبت کنید.